OddsOS
A quantitative sports product we built end to end. Same engineering depth we put into every client build.
Visit oddsos.com →A short, ranked daily card that beats the closing line more often than not. And keeps getting sharper on its own.
One card per sport per day. Four tiers: locks, value plays, strong parlays, longshots. No human babysitting required to make the next day's card better than the last.
Closing Line Value (CLV)
Our locks beat the closing line on average. This is the only honest proxy for "we found an edge Vegas missed."
Tier hit rate
Locks hit at or above their implied probability. Strong parlays hit more than chalk suggests. Longshots hit often enough to be entertaining.
Subscriber retention
People come back because the card is fun, ranked clearly, and correct often enough. We avoid the vanity-metric trap of "raw win rate yesterday."
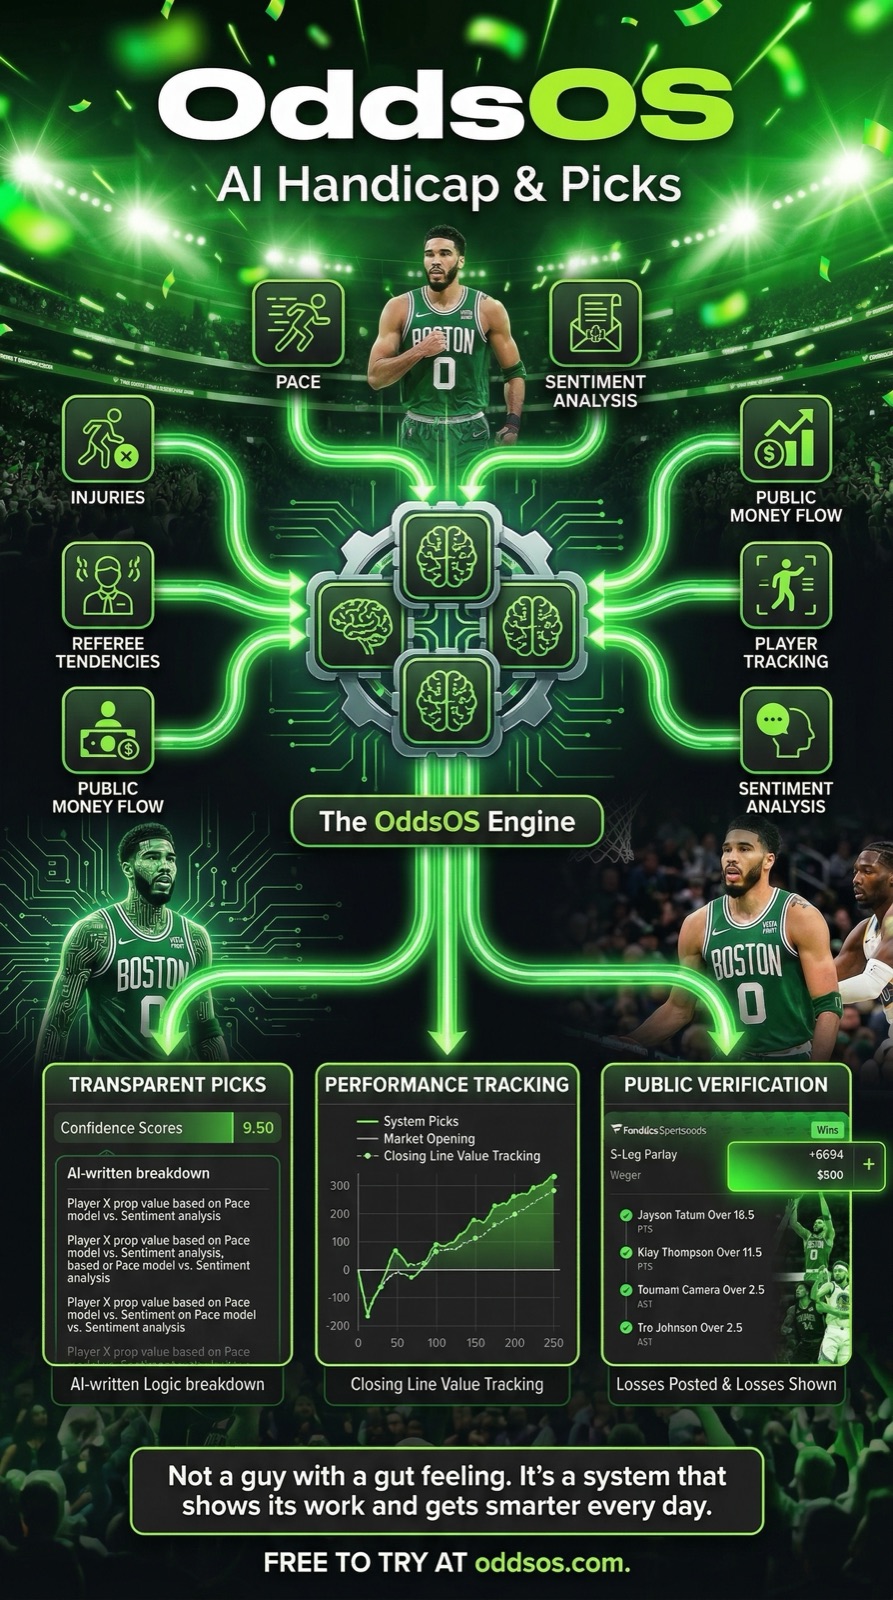
15+ orthogonal signals. One calibrated probability.
Most operators rely on 2-3 inputs. The OddsOS ensemble fuses 15+. Each measures a different aspect of the same bet. The output is one probability, calibrated against thousands of past outcomes.
Injuries
Real-time roster status, minutes restrictions, late scratches
Line moves
Direction, magnitude, velocity across all 11 books
Sharp money
Reverse line moves vs. ticket %, alignment scoring
Public bias
Where 80%+ of tickets are — and how often that's wrong
Referee tendencies
Foul rates, pace impact, OVER/UNDER lean by crew
Venue
Home-court magnitudes, altitude, schedule effects
Travel
Time-zone changes, miles flown, B2B impact
Rest
Days between games, schedule density
Momentum
Recent form, win streaks, statistical trajectories
Sentiment
Public narrative, locker-room reports, social signal
Teammate injury usage
When a teammate is out, how player usage shifts
Recency-weighted averages
Last 5 vs. season — which the model trusts and when
Line-shop boost
EV gain from picking the best of 11 books
Player context
Minutes, usage, last-5 average, line, matchup rank
Calibration drift
Per-market calibration weights updating in real time
Four tiers. Each with its own quality bar.
Every game day produces one card per sport with four tiers. Quality bars are non-negotiable: if fewer picks meet the bar, we publish fewer. We don't backfill with weak ones.
Locks
5 per sport per dayTop straights or props passing the Lock Quality Bar. Composite mode score above threshold. If fewer than 5 meet the bar, we publish fewer — never weak picks to fill.
Value plays
5–10 per sport per dayPicks below Lock threshold but above the Publish floor. Marked as "value" or "edge" so users know exactly what they're getting.
Strong parlay
1–2 per sport per day2-3 leg parlay from the Lock pool. Correlation-aware: prefers positively-correlated legs (team ML + team OVER, or star's OVER points + team OVER total). Probability ≥ 0.30, odds +150 to +400.
Longshot parlay
1–2 per sport per dayMulti-leg longshot built for entertainment + ceiling, not predictable profitability. Marketed honestly: "if it hits, it hits big — most days it won't."
Six places. All measurable.
Signals fused per pick
No single Vegas trader weighs all 15. Our ensemble does.
Books shopped per pick
Best price across 11 sportsbooks. Free EV before our model fires.
Monte Carlo sims per parlay
Correlation-aware simulation. Same-game legs aren't treated as independent.
Settled picks to detect drift
Per-market calibration catches misbehaving lines fast.
Tiers per daily card
Locks, Value, Strong Parlay, Longshot. Each with its own quality bar.
Sports, separate ensembles
NBA + MLB + NFL each have their own engine, calibration, gates.
Best of 11 books. Free expected value.
Picking the best price across 11 sportsbooks is structural EV. Guaranteed before our model fires. Most operators publish at the first book they see; we publish at the best.
Example: same bet listed at -115 on the worst book vs. -105 on the best. That's a 9.5% improvement on the same wager. Compounded over a season, this alone separates winners from losers.
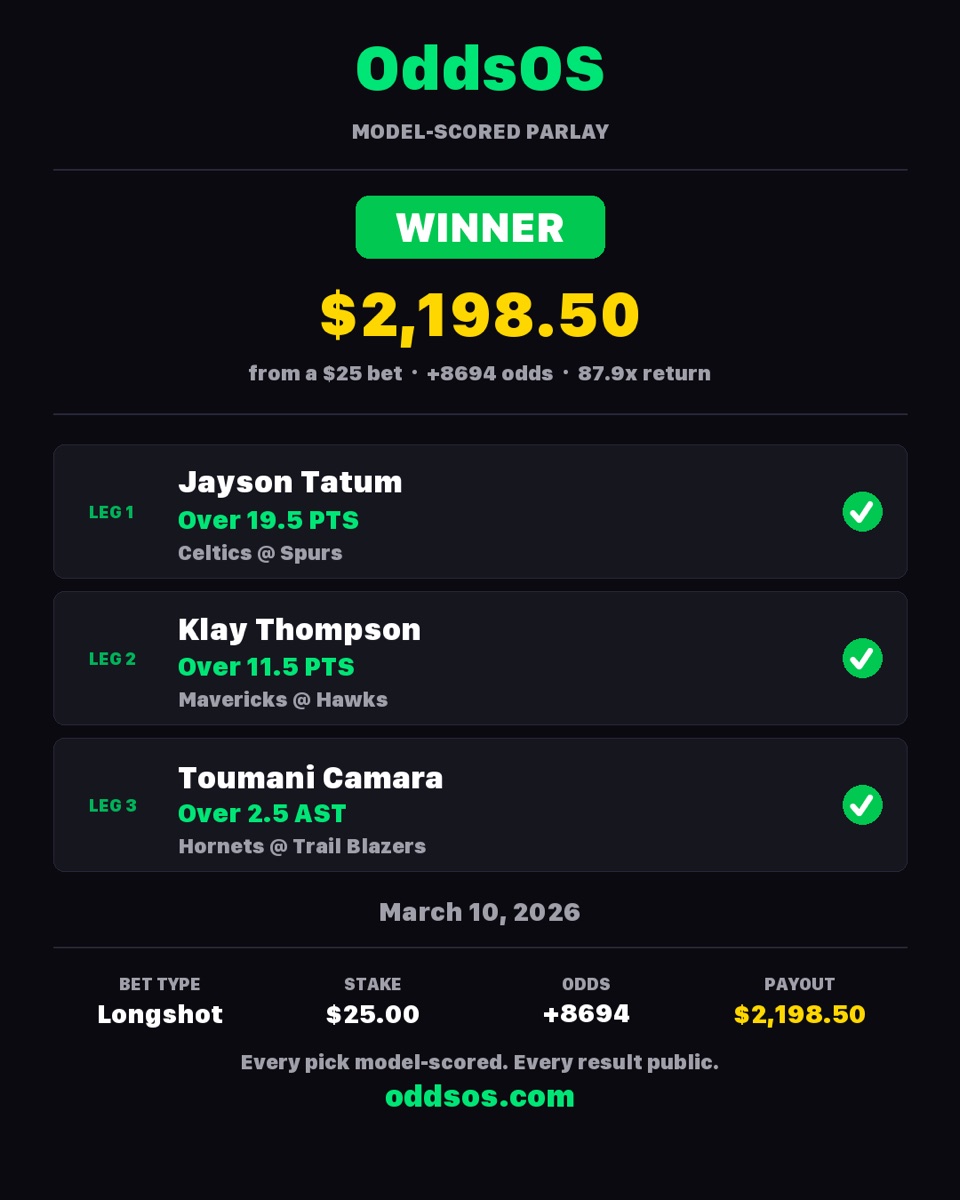
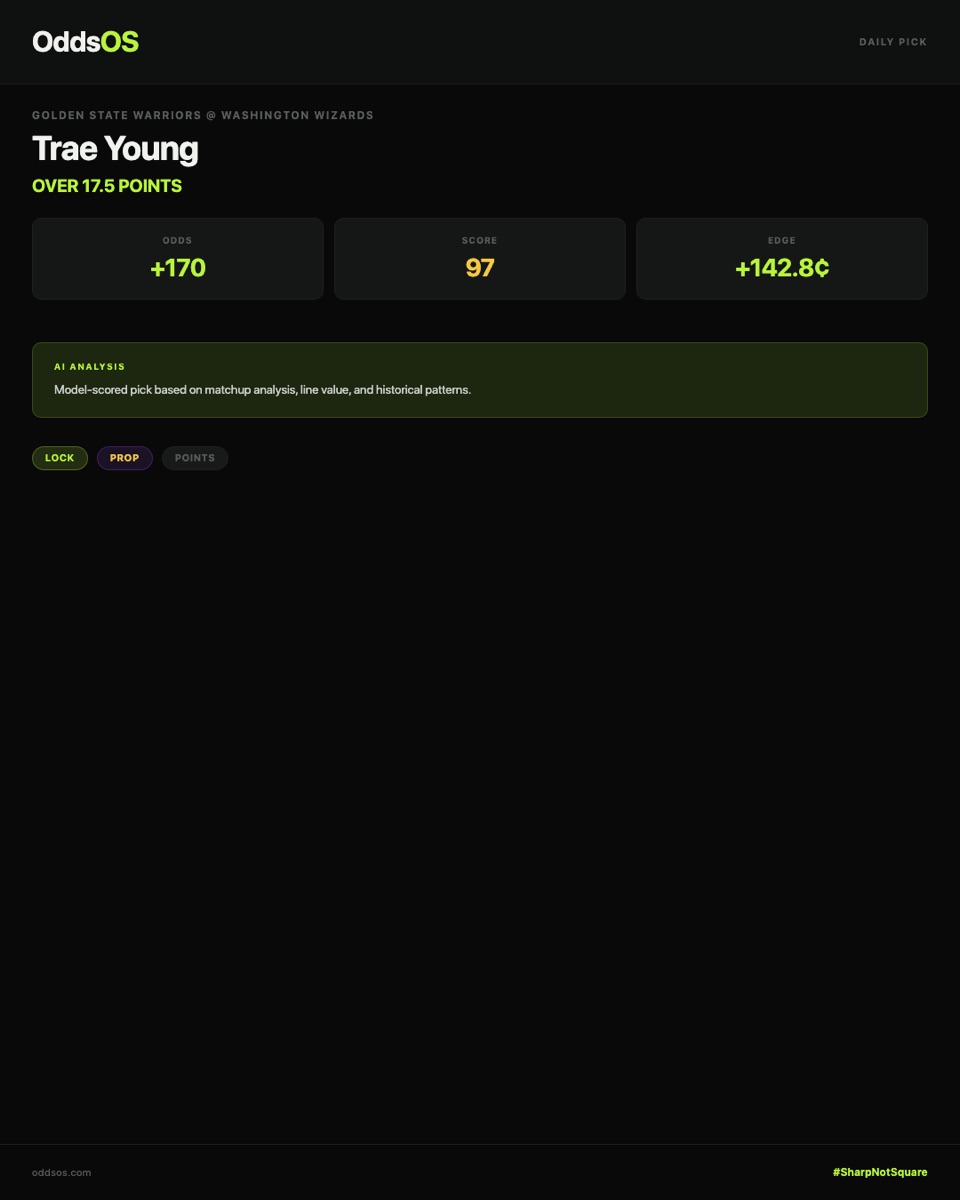
This isn't a deck. It's the live product.
The picks below are real published cards. The parlay card on the left is the structured output our model generates daily. The post on the right is what subscribers see in their feed each morning.
The stack, layer by layer.
Frontend
Custom web app · responsive · daily-card UI · locked visibility states
Backend
Python · FastAPI patterns · Postgres · SQLite snapshots · Alembic migrations
ML
LightGBM + XGBoost · per-market calibration · settlement-driven retraining
Data
11-book odds aggregation · signals_loader · injury feeds · referee data · sharp-money detection
Edge measurement
Closing Line Value tracker · per-tier hit-rate vs. implied probability · CLV alerts
Operations
Cron-driven daily flow · backtesting harness · rejection_metrics + signal_attribution tables · self-improving loop
The model isn't just trained. It's measured.
These are real plots from production. Top row: predicted probability vs. observed win rate (a calibrated model hugs the diagonal). Bottom row: model edge vs. realized win rate (a model with edge slopes upward). Generated nightly per sport.
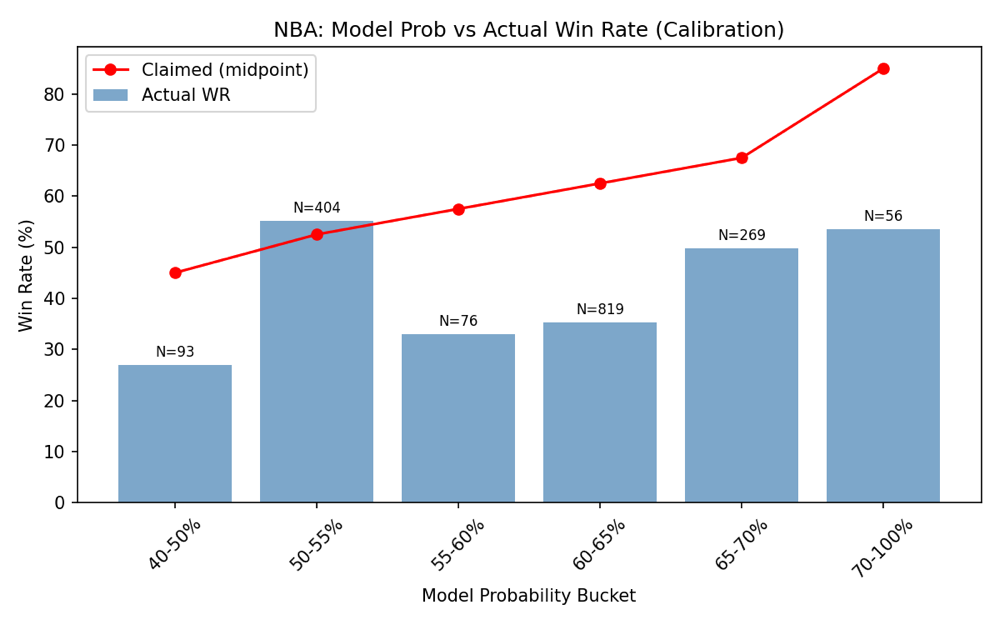
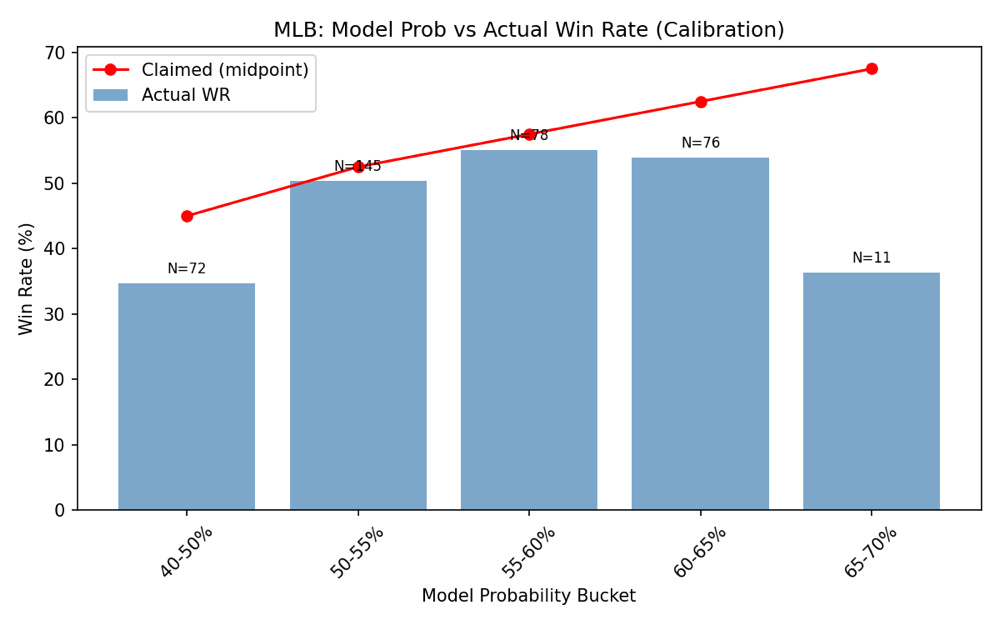
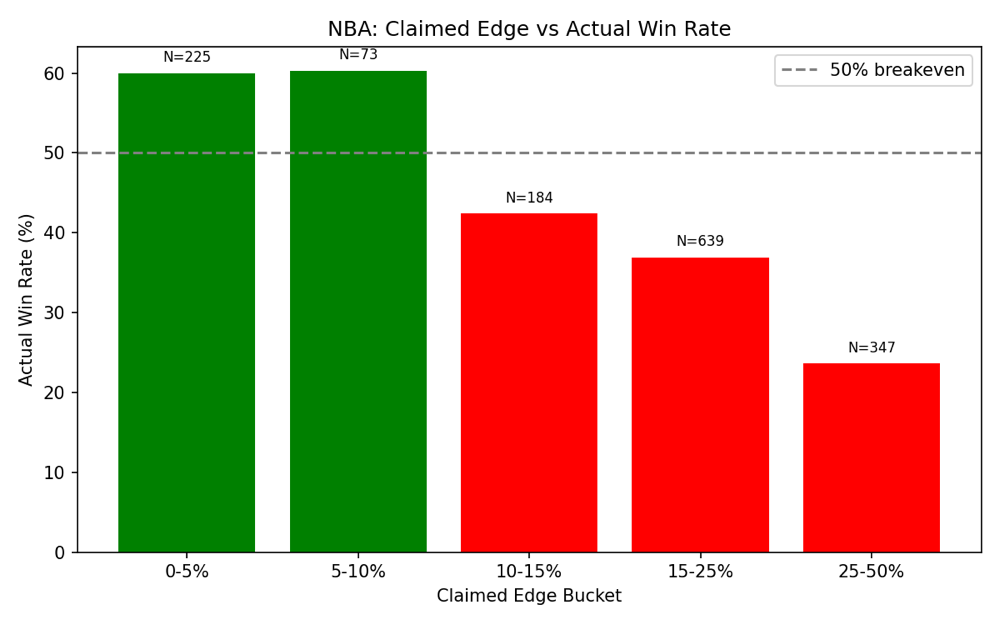
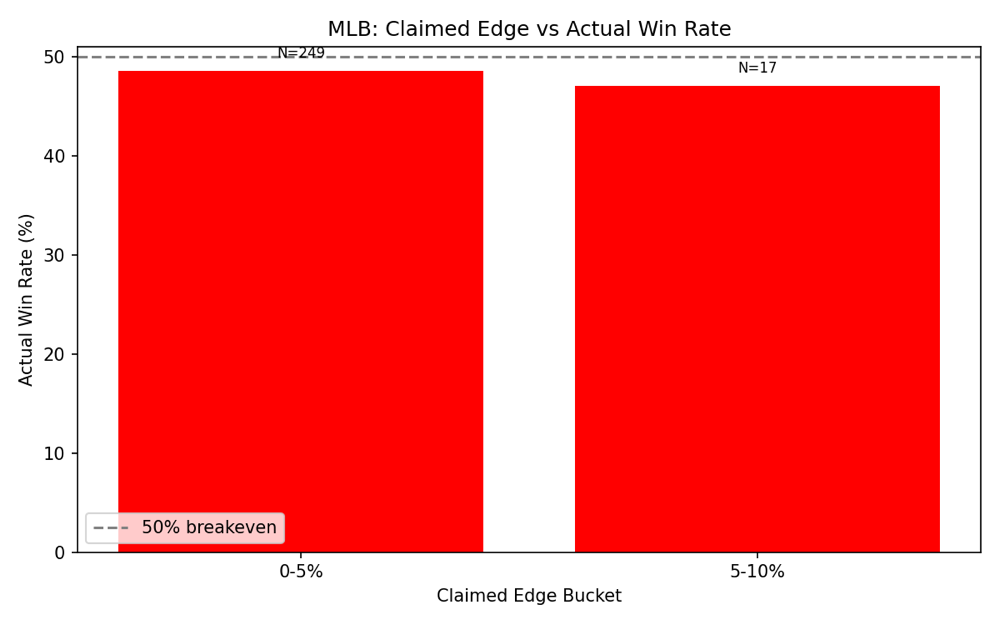
If we can build calibration plots for OddsOS, we can build the equivalent for your business: honest KPI tracking that ties activities to revenue, not vanity metrics.
Where the model has no edge.
Documenting where we don't try to win is part of why this works. The "do not publish" list isn't fixed forever. Expansion requires data, not vibes.
- Tight efficient h2h markets on marquee games (everyone has the same info)
- Futures, season-long, live in-game (not our surface)
- Exotic props in thinly-booked markets (<3 books)
- Markets with fewer than 30 settled samples (no calibration data)
- Backfill weak picks to hit a quota (we publish fewer or none)
If we can ship a system this deep for OddsOS, we can ship one for your business.
OddsOS is not a side project. It runs in production. Live users, money on the line, hard data-quality requirements. The same engineering powers every client build: data fusion, ML calibration, scheduled production flows, edge measurement, self-improving loops.
Multi-source data fusion
11 odds APIs, injury feeds, sharp-money detection. We merge messy heterogeneous data daily. Your equivalent: CRMs, ad platforms, Stripe, QuickBooks all in one dashboard.
ML calibration in production
LightGBM + XGBoost models that update from settled outcomes. Your equivalent: scoring leads, predicting churn, classifying inbound, ranking opportunities.
Scheduled production flows
Daily cron-driven generation, publishing logic, locked visibility. Your equivalent: morning sales briefs, automated reports, scheduled content campaigns.
Edge measurement
CLV tracking, per-tier hit-rate, signal attribution tables. Your equivalent: real KPI tracking that ties activities to revenue, not vanity metrics.
Self-improving loops
The system proposes scope changes quarterly based on data; the human operator confirms. Your equivalent: outreach copy that tunes itself based on what gets responses.
Honest scope
We document what the system can't do. Your equivalent: we won't sell you AI when an Airtable + Zapier setup will do, and we'll tell you exactly why.
Book a $1,250 workflow audit.
1-2 weeks, fixed scope, written proposal at the end. The audit fee credits 100% toward the build if you proceed.